
Most AI marketing ROI math is hand-wavy.
Someone runs a few prompts, ships some content faster, and the leadership deck shows “10x productivity.” Someone else implements an agent, fails to log the workflow, and three months later nobody can tell whether the line went up because of the agent or because of the new SEO push that happened the same quarter.
The hand-waving is partly the vendors’ fault and partly ours. The category is genuinely new, the measurement playbook isn’t fully written, and the temptation to claim a big number for the slide is strong.
This post is the framework we use when we actually have to defend the ROI math to a CFO. It’s not perfect. But it’s specific enough to be argued with, which is the most you should expect from a measurement framework in a category that’s still moving fast.
For the broader stack context that this measurement sits inside, our complete AI marketing stack post is the operating-model companion.
The first honest answer: most teams are measuring the wrong thing
When marketing leaders ask “what’s the ROI of AI in our marketing?”, they usually mean one of three different questions:
- Did we save time?
- Did we ship more?
- Did we make more money?
Those are all reasonable questions. They’re also different questions, and conflating them is where most ROI claims fall apart.
A team that drafts a blog post in 2 hours instead of 6 saved time. That doesn’t mean they made more money. A team that ships 4 posts a month instead of 2 shipped more. That doesn’t mean they made more money either, especially if half the new posts don’t drive traffic. A team whose AI-assisted lifecycle emails lifted conversion 8% made more money. That one matters.
The framework below separates the three explicitly.
The four-layer ROI framework
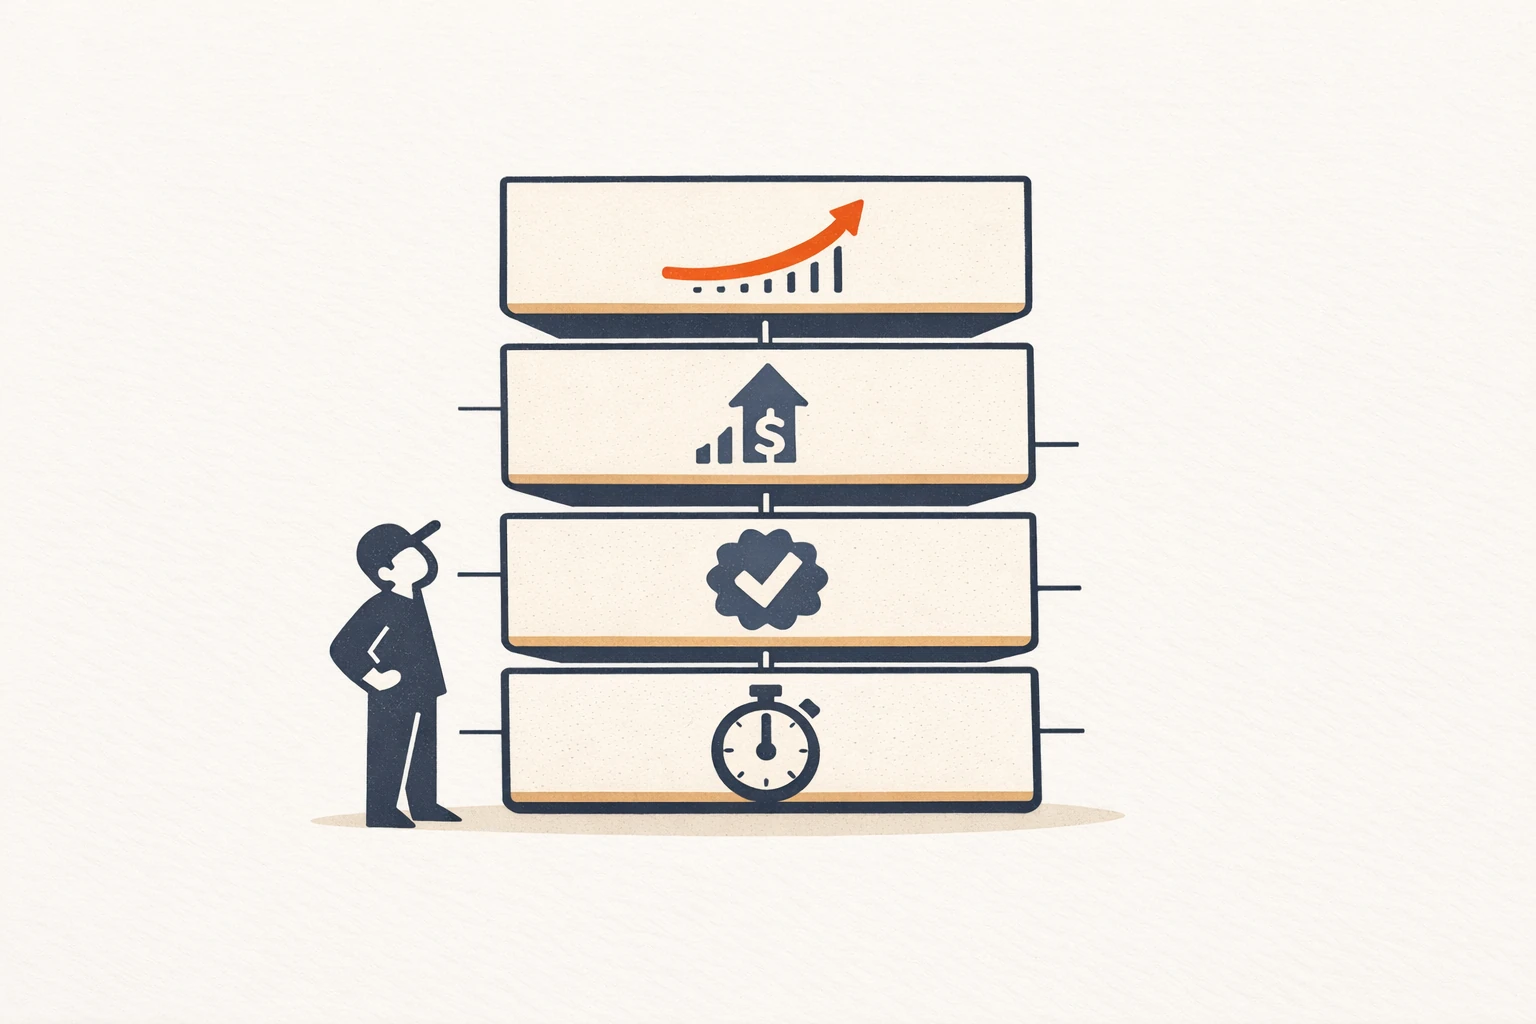
We measure AI marketing ROI on four layers, in this order:
- Time saved (input efficiency)
- Output quality (production quality)
- Conversion impact (downstream business effect)
- Learning rate (rate of improvement)
You should expect to be honest about layer 1 immediately, layer 2 within a month, layer 3 within a quarter, and layer 4 within six months. Anyone claiming all four numbers in week two is either lying or measuring something else.
Layer 1: time saved
This is the easiest layer to measure, and the one most teams overclaim on.
The honest version: pick three workflows the team runs at least weekly. Time them before you bring in AI. Time them after. Subtract.
The dishonest version: ask the team how much time AI is saving them. Multiply by an annual headcount cost. Put it on a slide.
The dishonest version is wildly inflated for two reasons:
First, perceived time savings are bigger than actual time savings. People remember the moment AI gave them a useful first draft and forget the 15 minutes they spent rewriting it.
Second, time savings on workflows nobody was doing don’t count. If AI lets you ship 4 blog posts a month when you used to ship 2, you didn’t save 2 posts of writing time; you spent the same time writing 4 posts. That’s a different ROI question (covered in layer 2).
A useful time-saved measurement looks like:
- Workflow: weekly performance report
- Pre-AI: 4 hours every Friday, manager-level operator
- Post-AI: 1 hour every Friday, same operator
- Time saved: 3 hours/week × 50 weeks × $150/hr loaded = $22,500/year on this one workflow
Multiply that across 4-5 recurring workflows and you have a real number. We covered the recurring-workflow pattern specifically in our Hermes Agent for marketing automation post and our Hermes Agent local SEO post.
Layer 2: output quality
This is where ROI math gets harder.
Producing more content faster only matters if the content is at least as good as what you were producing before. Two posts a month that drive traffic beat four posts a month that don’t.
The honest measurement requires comparing pre-AI and post-AI outputs on three dimensions:
- Production quality (did it ship at the same standard?)
- Performance (did it perform at the same standard?)
- Brand fit (did it sound like the brand?)
We use a simple before/after comparison for each new workflow. Pull 5 outputs from before AI was involved, 5 outputs from after, score them on a rubric the team agreed on in advance. The math is fuzzy but better than vibes.
What you’re trying to avoid: the version of “AI productivity” where you ship more, but the new outputs are worse, but nobody admits it because admitting it would invalidate the whole rollout.
For the practical content-quality bar that actually matters, our 30 ChatGPT prompts for marketers post covers the prompt design that produces output worth comparing in the first place.
Layer 3: conversion impact
This is the layer that actually answers “did we make more money?”
It’s also the hardest to attribute cleanly. Marketing has spent thirty years building attribution models that struggle to assign credit between channels; adding “AI-assisted” as a dimension on top of that is not making the math cleaner.
The pragmatic measurement approach is to focus on workflows where the output ships in isolation, so the AI’s contribution can be cleanly tested:
- Subject line tests: AI-generated vs. human-written, same audience, same content. Measure open rate.
- Landing page hero copy: AI variant vs. control, same traffic source. Measure conversion rate.
- Ad creative variants: AI-generated vs. human-written, same campaign. Measure CTR and downstream conversion.
Workflows where the AI output is one ingredient in a larger pipeline (a blog post that the AI drafted but a human heavily edited) are much harder to credit. Don’t pretend you can. Be honest that the contribution is real but unmeasurable, and lean on layers 1 and 2 for those.
What the marketing literature calls “uplift modeling” is the formal version of this. The iterable post on AI marketing ROI stats and IBM’s piece on AI ROI are useful reference points if you want to go deeper than the simple test designs above. Forbes’ 2025 survey on AI ROI measurement challenges is also worth reading because it captures how badly most enterprises are still missing this layer.
Layer 4: learning rate
The fourth layer is the one most teams skip, and it’s the one that compounds.
A workflow that gets 5% better every month compounds to roughly 80% better over a year. A workflow that gets 0.5% better every month compounds to about 6% better over a year. The difference is enormous, and it’s almost entirely about how seriously the team feeds back results into the next iteration of the workflow.
Concretely, learning rate is measured by:
- How fast you identify a failed pattern (the AI-drafted thing didn’t work)
- How fast you update the workflow to remove the failure
- How fast you identify a new pattern that does work
- How fast you spread the new pattern across the team
Teams that don’t measure layer 4 end up running the same broken workflow for a year and reporting flat performance. Teams that measure layer 4 see the compounding effects most ROI claims promise.
The pattern that works for us: a 30-minute weekly review of every AI workflow’s outputs from the previous week, with explicit pattern-update notes. Boring, important. McKinsey’s research on the state of AI consistently finds that the organizations capturing real value are the ones with disciplined feedback and measurement loops, not the ones with the biggest tech stacks.
What good ROI numbers actually look like
For a small marketing team (3-7 people) deploying agents over 6-12 months, the honest numbers we see settle around:
- Layer 1 (time saved): $50K-$200K/year in equivalent loaded labor cost, depending on team size and workflow count.
- Layer 2 (output quality): output volume up 30-100% on workflows that absorbed AI, with quality steady or modestly higher when the team treats AI output as a draft and not a deliverable.
- Layer 3 (conversion impact): typically 5-15% lift on isolatable workflows where you can clean-test (subject lines, landing page hero, ad creative). Mid-funnel and full-pipeline numbers are messier.
- Layer 4 (learning rate): the meta-effect that takes year-2 results well past year-1 if the team is disciplined about feedback loops.
The teams claiming “10x productivity from AI” in the first month are mostly measuring layer 1 of a single workflow and treating the savings as if they generalized across all four layers. They don’t.
What to put in the leadership deck

Three slides:
Slide 1: Time saved. Specific workflows, hours, dollar equivalent. Easy to defend. Don’t inflate.
Slide 2: Output and quality. Volume change, quality change, performance change on the workflows that absorbed AI. Show the rubric.
Slide 3: Conversion impact and learning rate. A small number of clean tests with results, plus a description of how the team is feeding learning back into the workflows. Be honest about what you can’t measure cleanly.
Three slides. No “10x” headline. The CFO will trust the second deck more than the first one, and so should you.
For the consulting view of how to structure this for client work, our AI marketing consultant post covers what the engagement actually looks like. For the team-shape question of who runs all this, our 2-person AI marketing team post is the companion read.
The honest answer to “is the ROI worth it”
Yes, with conditions.
The conditions are: you build two or three workflows well instead of eight badly, you measure each of the four layers explicitly, you put a human review checkpoint at every place where mistakes would matter (the safety operating model is in our open-source AI agent safety post), and you give the rollout six months before evaluating.
Teams that do those four things see ROI that justifies the investment. Teams that don’t end up with a folder of impressive demos, a vendor bill, and no defensible numbers for the leadership deck.
If your team wants help building the measurement framework into the rollout from day one, our services page explains how we work, and you can get in touch here.
FAQ
How long until we should expect a positive ROI? Layer 1 (time saved) shows up in the first month if you’re tracking it. Layer 2 (output quality) takes a month to compare cleanly. Layer 3 (conversion impact) takes a quarter, and only on workflows where you can clean-test. Layer 4 (learning rate) is the long tail that compounds for years if you measure it. If your CFO wants a single payback-period number, anchor on the layer-1 numbers and treat the rest as upside.
What’s the biggest mistake teams make in claiming AI marketing ROI? Conflating perceived time savings with actual time savings. People remember the magic moments and forget the rewriting. The honest measurement is a stopwatch on three recurring workflows before and after, not a survey of how much faster the team feels.
How do we measure ROI for an AI workflow that’s just one ingredient in a larger pipeline? Mostly, you don’t. Workflows where the AI output ships in isolation (subject lines, hero copy variants, ad creative tests) can be clean-tested. Workflows where AI is one ingredient (a blog post that the AI drafted but a human heavily edited) can’t be credited cleanly. Be honest about that. Lean on time saved and output quality for those, not on conversion attribution.
Should we share AI marketing ROI numbers externally? Carefully. The numbers most teams have right now are first-quarter, single-workflow measurements that don’t generalize. Sharing them externally creates expectations you’ll have to defend. If you do share, share the four-layer framework, not a single ROI percentage. The framework is more honest and more useful for whoever you’re sharing it with.


